Why is Microsoft Power BI so Great ?
Why is Microsoft Power BI so Great ?
Power BI is a platform for sharing and visualising data either using a web browser or the Power BI Client software running on the desktop or mobile.
Power BI Desktop is the workhorse application letting you clean, shape, and upload data and design a set of reports containing interactive data visualisations such as charts and maps and so forth. You upload both the data visualisation reports and the data itself once the design process is complete for others to view with the client software.
The uploaded reports and data can be used to create a dashboard on the web showing key performance indicators and selected charts in a summary fashion with a drill down to the underlying reports and data. These are best viewed with the Power BI Client and there are many options to encourage sharing and modifications of the existing reports.
Power BI Desktop is completely free to use and you can view the reports and data using the Power BI Client for free. Microsoft Licensing is very reasonable compared with the competition and it is when you begin to share the dashboards and reports between users that the Power BI Pro license is required at a cost of £7.50 per month per user.
This blog post gives you an overview of the high-level features and options of the Power BI platform to give you an indication of how powerful the system is at distributing data visualisations throughout your organisation.
Microsoft
One reason that Power BI is so great is that Microsoft must have deployed a great team to this project. Microsoft Power BI came out first in 2014 at the same time as Watson from IBM and remains under active development. There are new features appearing monthly and the application can be deployed to the Cloud and connect to your own databases and output to a web browser or Office 365 and even your mobile phone.
Power BI Desktop is the design powerhouse allowing you to connect to a myriad of data sources and create interactive reports and charts that select and filter data as you click around the interface. Clicking on a column in a bar chart will interactively filter the data that shows in the tables on the screen. You can easily export the data or bring the whole report into Excel if you want to do further analysis.
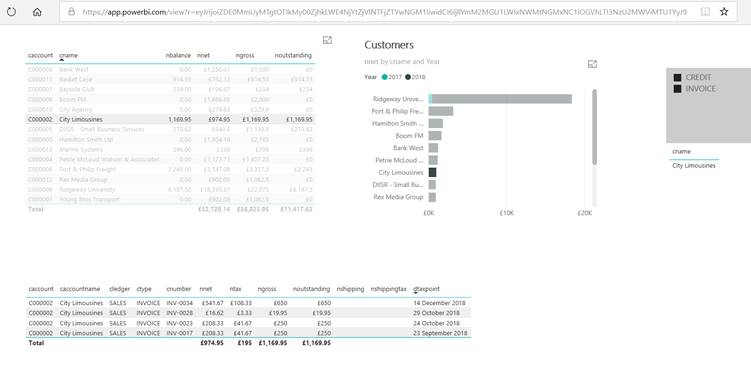
Please open our Power BI Report from Xero Accounting to see an example of the interactivity at work. In the screenshot bellow we have clicked on the City Limousines record in the grid at the top left of the screen and the lower grid and the chart have refreshed automatically to show only records relating to that customer. Clicking on a blank area of the chart will restore the filter to show all the data. Please try it.
The reports that you design in Power BI Desktop are exported to the internet and shared easily with other users, some of whom can copy and modify the reports for added business intelligence. Power BI on the web is used to create dashboards which take items from the reports to display in a summary dashboard interface showing for example the KPIs (Key Performance Indicators) for the business.
Dashboards and reports are consumed with the BI Client application which provides all the interactivity you have designed into the data. There is a mobile client too and all reports can be rearranged so they display on mobile devices.
Data preparation can be a large part of the BI process and the Power BI Desktop has many features to help clean and organise data to be presented. A simple Gateway is made available so you can update the data held against the reports several times each day so the consumers of the dashboard and reports get up to date information refreshed automatically.
Competition
Qlik and Tableau are major competitors and have great software for organising data and designing interactive Business Intelligence reports that are distributed to users from a central database and reporting infrastructure.
Remember that there are also many experts working in the field of Data Visualisation who can create impressive web pages for visualising data. Data Scientists using Python and R combined with Data Visualisation are skilled at creating and charting data whilst applying statistical and machine learning analyses for Business Intelligence.
Business Intelligence
Business Intelligence in the context of Power BI has come to mean the preparation of data that is made available to a large number of corporate users who are given a lovely user interface to filter and visualise data interactively together with associated dashboards to show business KPIs.
Qlik, a major competitor to Power BI, estimates that corporate data was locked away and made available to less than a quarter of people in the business before this type of tool came along which now makes data available to over 50% of the people in the business. The ability to filter and download this data greatly extends the usefulness of the information in helping people make business decisions using data that is useful and appropriate to them.
The next stage in this evolution is to make data available in a form that is useful to all members of the organisation and moving the data on to mobile devices is one way of achieving this. In addition, Qlik are pushing the idea of digital literacy where the end users need to be comfortable with extracting and analysing data for use in their daily duties.
The term "Business Intelligence" is also applied to database algorithms that apply machine learning for analysis and interpretation of data. There are well known algorithms for example that will analyse the shopping history of a customer in a supermarket and work out that every time a young father buys nappies, he also buys beer. Microsoft has bundled these in to SQL Server in the past and now makes them available with Azure Machine Leaning.
Data Science practitioners apply common statistical algorithms to cluster data together to create groups of similar customers or to predict churn and other patterns in the underlying data. They often use Python which has extensive libraries of statistical and machine learning methods to process and analyse data.
Power BI does have some features to incorporate Python and R into the data workflow for Data Scientists to use but we expect more work is required from the Power BI development team to make this type of integration easy with Power BI. It is worth remembering that Business Intelligence can involve machine learning and should be more than data preparation and visualisation.
Technologies
Power BI Desktop leverages several longstanding Microsoft technologies but hides their power behind a relatively simple user interface. You might view Power BI as a souped-up interactive Excel whiteboard but behind this lies a combination of technologies:
- Power Query lets you import and manipulate data sources as you bring data in to the model so you can define fields as text, numeric date and so forth and clean up and combine data as you like. There is a powerful underlying language called M (M for Mashup) that you can use if you need advanced features and this powerful technology has been used in Excel for many years.
- The DAX language is an evolution of the data manipulation language used by Microsoft to manipulate the data cubes that formed part of the specialised OLAP databases still used to slice and dice data in massive data warehouses. Power BI Desktop allows you to quickly define new columns and tables using this powerful language and extend the data model after the data has been imported.
- xVelocity is the internal database engine used by Power BI to filter and prepare data for visualisation and is specifically optimised to slice and dice data instantly. Although there is a limit of 1GB to a data model for standard users - the data is compressed cleverly so a value stored in a text column for example occurs once in the database and so takes up little space if a million records only have four or five different values.
- The best and fastest data models for Power BI upload all the data into the data model for optimised filtering and data visualisation but it is possible to connect directly to a database for some queries and also to an optimised data warehouse (using Microsoft technology) to access truly vast databases and continue to filter and present data interactively within Power BI.
- Each Power BI report can be viewed and optimised for display on a mobile device and a Power BI client for Android and iPhone allows the distribution of reports over the mobile phone network easily.
- A data Gateway (running on your desktop) allows you to configure your machine to regularly update the data model with fresh data shared by all the consumers of the data using Power BI on the web or mobile. This gateway can be extended to share data with new Microsoft technologies such as Microsoft Flow and Microsoft PowerApps.
- Python and R scripts can be integrated with Power BI to extend the data model using techniques familiar to most Data Scientists so they can perform advanced statistical analysis or machine learning on the data (in practise this might be done before feeding the data into the data model).
All the above technology provides a means for preparing data to visualise on the desktop or mobile device as a table or chart or map. The Power BI interface allows for data to be instantly filtered by the user and for all the visualisations to update interactively. Microsoft supply charts and visualisations to cover most requirements and additional custom visualisations are available from third parties.
A lot of effort is required typically for a Power BI Implementation to extract and prepare the data for the data model. This is known as ETL (Extract, Transform, Load) in traditional data warehousing environments and the combination of Power Query and DAX gives Power BI formidable power here hidden behind the easy-to-use interface of Power BI Desktop.
There are many data sources that can be accessed natively using Power BI and a handful of these can be used with a direct connection (not MySQL or OData) so that user interactions to filter data access the underlying database in real time. Power BI can also access Microsoft Data Warehousing technology in real time. However, for most businesses, data is prepared with the Power BI Desktop and uploaded to the Power BI platform manually or updated several times a day with the Gateway.
Until this month (December 2018) it was not possible to use the powerful data preparation and cleaning facilities of Power BI Desktop to prepare data to import into Microsoft Data Warehousing technology but it seems that Microsoft are beginning to address this with their Dataflow technology.
DAX is the secret spice within Power BI allowing shaping of the existing data to create new tables or columns in tables or measures that express Key Performance Indicators for the underlying data. It seems that most of the data visualisations used by Power BI use DAX to shape the data they require for visualisation and mastery of DAX considerably extends what you can do with Power BI.
Power BI has an API interface that allows you to control data updates and also embed Power BI within your own application to present data visualisations to your organisation or your customers. One thing we need to investigate at Redware Research Limited for our use case is more flexible means of updating the underlying data for Power BI reports so we can share the same report between different users but provide each with their own data to view.
Pricing
Power BI Desktop is currently free which means you can experience Power BI on your desktop machine free of charge. You cannot create dashboards on the desktop and the compressed database size cannot exceed 1GB but otherwise, for solo use, the system is entirely free right now.
You can use the Power BI Desktop to publish to the Power BI platform where dashboards are created and reports shared between users. Although you can use the Power BI Client for free - there are limited options on what you can consume and share without a subscription.
Microsoft charge £7.50 a month to become a Power BI Pro user which means you can publish data and reports created with Power BI Desktop to be shared with other Power BI Pro users who can also access the reports and data and also share or build their own Dashboards. Power BI relies on some people in the organisation using Power BI Desktop (for free) to push reports and data to share with other Power BI Pro users all of whom need to pay the monthly license. If you have a few users the pricing is excellent compared to the competition and a single user can do most things for free with Power BI Desktop.
Additional options exist, for example, you can host your own Power BI environment on your own equipment from £3,500 per month or use additional Azure services to share embedded Power BI reports with all your users (or customers) and pay a usage fee instead of a monthly license.
Deployment
There are several different deployment options for Power BI consumers as detailed in Ras Reza's excellent Book - Power BI Infrastructure (Apress 2018). The available options are constantly changing right now because of the rapid development of the underlying infrastructure but usually are accessible to Power BI Pro Users paying a monthly subscription.
Some options include:
- Completely free access on your machine for a single user with Power BI Desktop with easy download into Excel.
- Limited free access to the Power BI Client. Power BI reports can be exported easily to a PDF or Microsoft PowerPoint.
- A Power BI report designed and implemented with Open Data can be published to the web for all to view for free.
- A Power BI Pro monthly for allows users of the Power BI Client to share and modify dashboards and reports on desktop, web or mobile with optional Office 365 group sharing features. A Power BI App combines reports together in an easily consumable form to be shared between Power BI Pro users (and replaces Content Packs).
- Embedded Power BI allows an organisation or software house to share Power BI reports embedded in an application to all users or customers without needing a Power BI Pro subscription (you pay per view).
- The Power BI Report server allows for an organisation to have their own platform for sharing Power BI Dashboards, Data and Reports with a (considerable) monthly cost.
Resources
You can download Power BI for free from Microsoft at https://powerbi.microsoft.com and also find resources for ready-made Content Packs and Apps and third-party visualisations and consultancy services.
Reza Rad is based in New Zealand and knows what he is talking about with Power BI. As well as running training courses he has published the last few years of his blog in e-book form available for free at http://radacad.com/.
Many Excel users are familiar with DAX and PowerQuery and this video from ExceIIsFun helped us realise how great Power BI is for accounting data - https://www.youtube.com/watch?v=iWsL5gM962U.
Redware Research Limited (that is us) have a Power BI Connector for Xero, Sage50C and QuickBooks Online to extract data from these accounting database for use with our Power BI Accounting Reports.